Creating an elevation map with GPS coordinate points
Published:
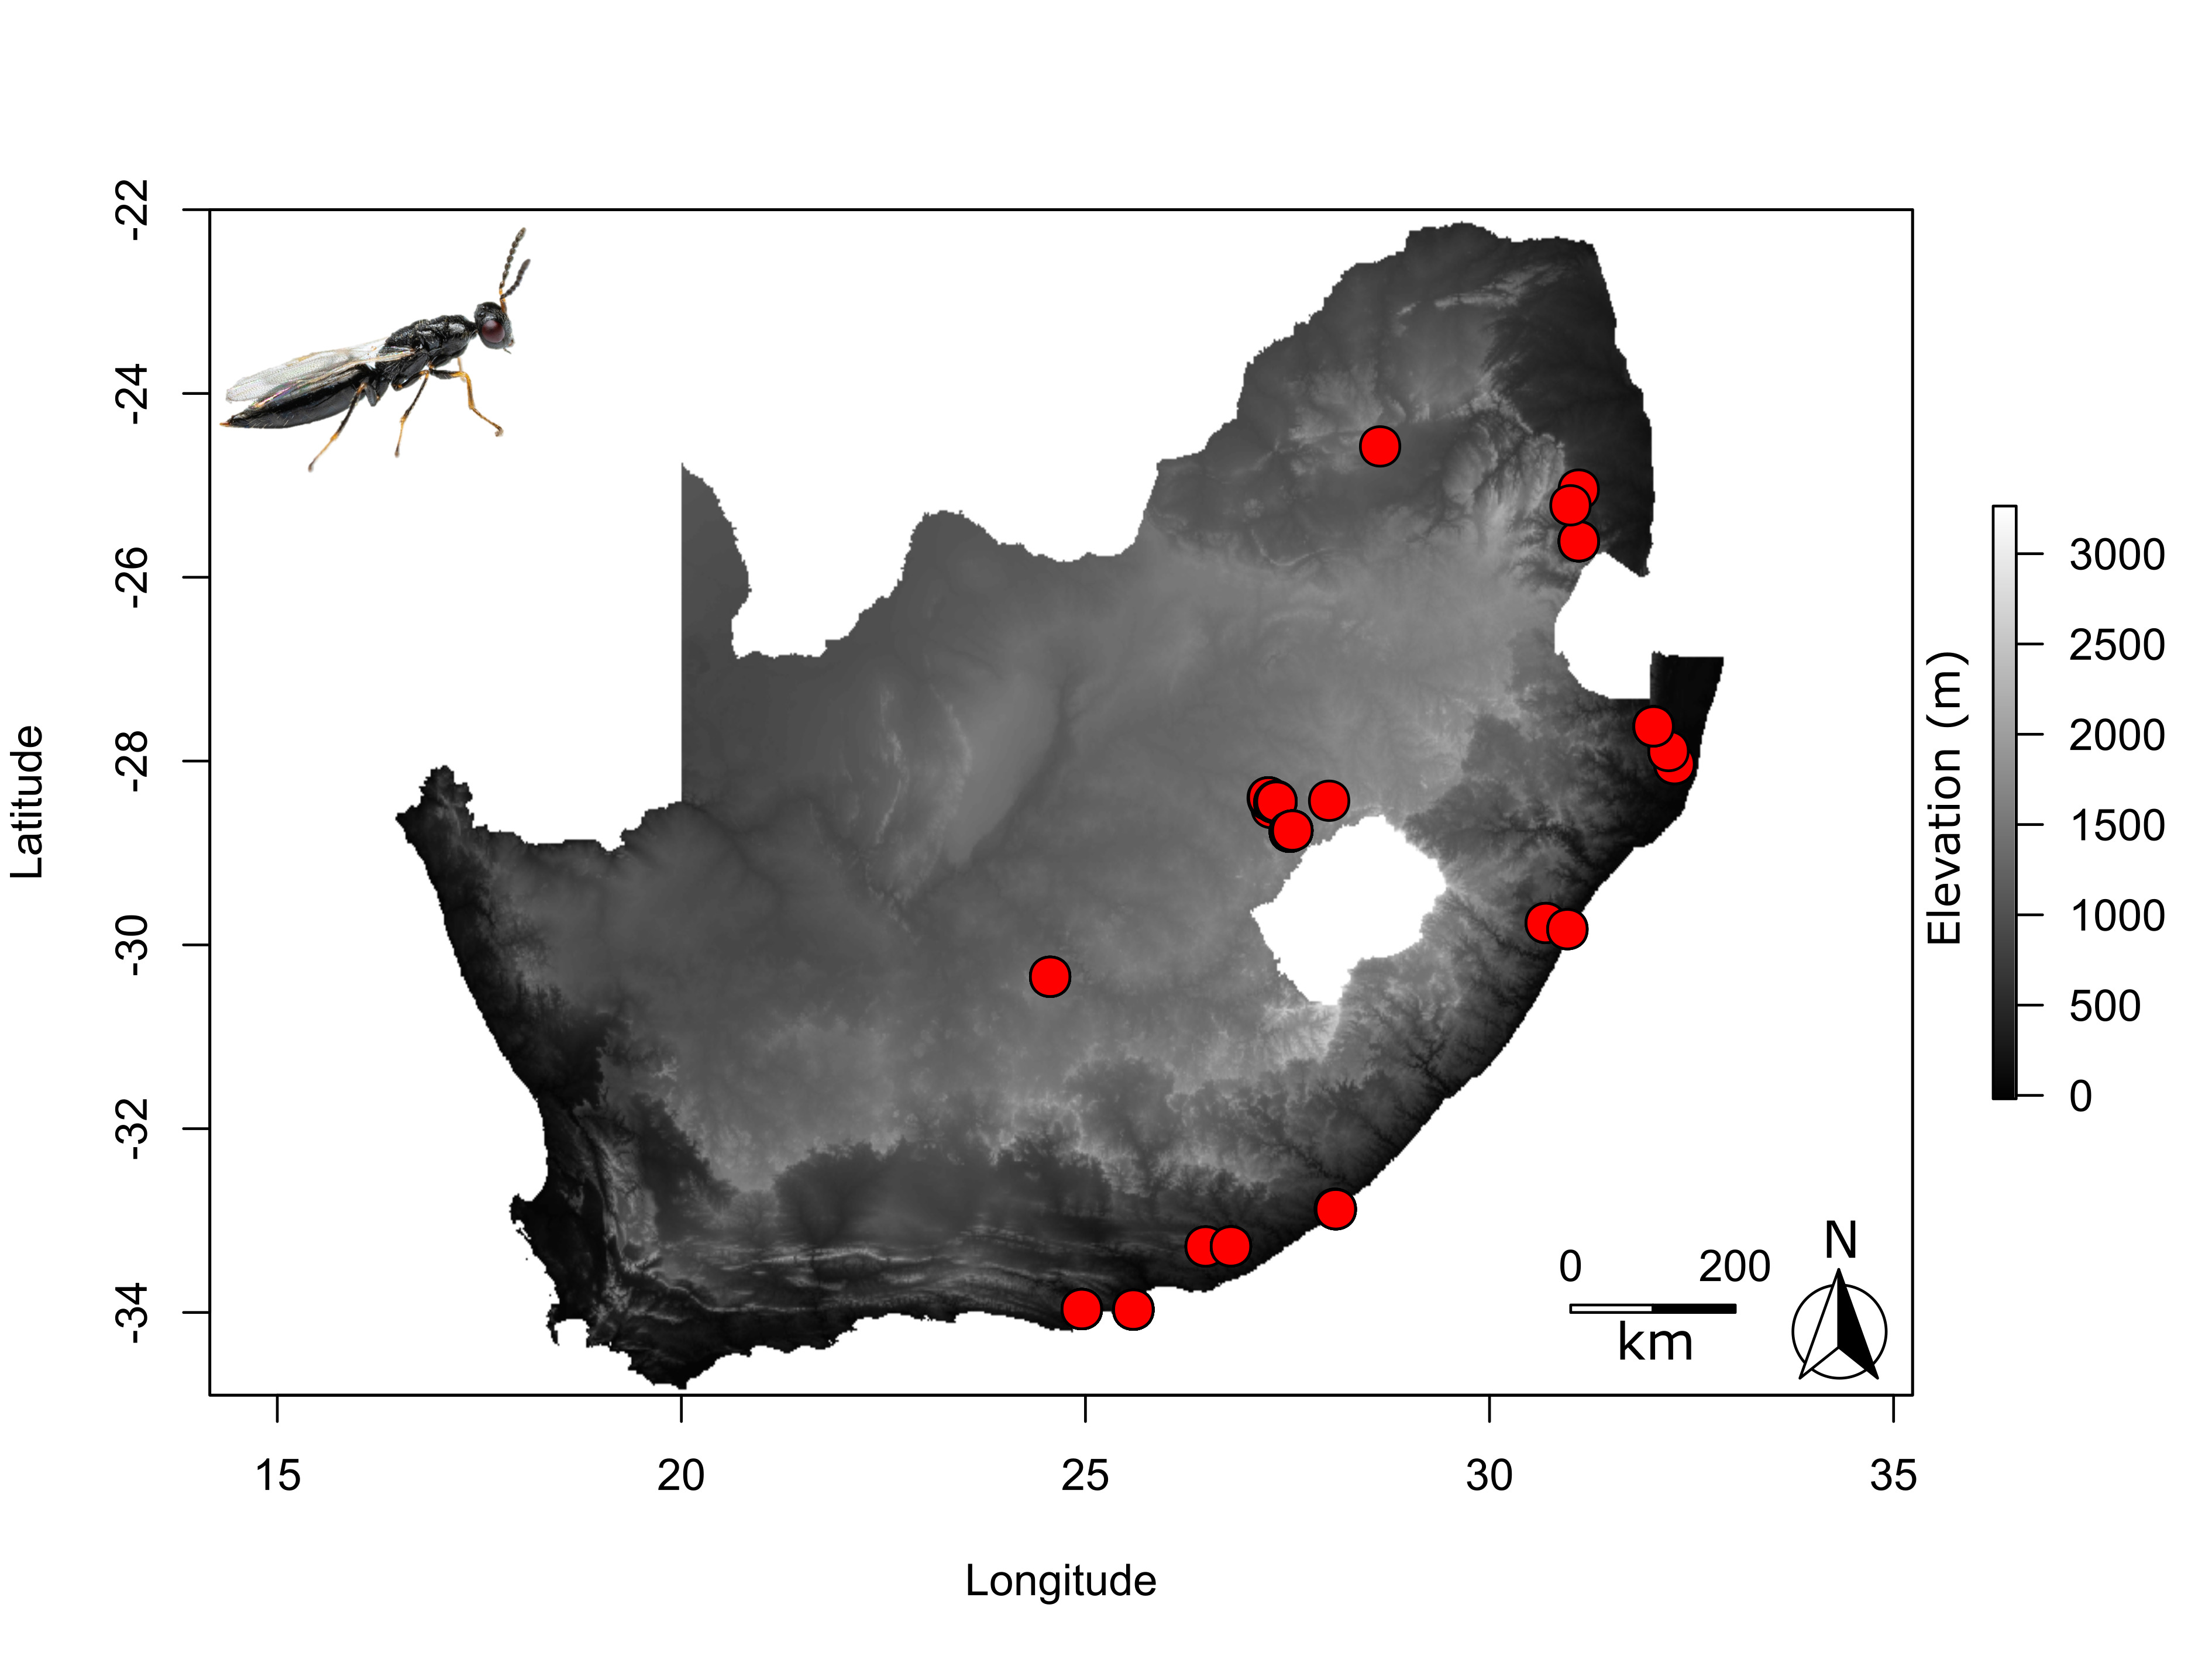
This R script plots the map of a desired country, and colours it by elevation. It then adds GPS coordinate points to it (for example sampling sites) from an Excel file. Check out the final image at the bottom of this post 😃. The North arrow and Tetramesa wasp was added manually later in Inkscape.
library(raster)
library(dplyr)
library(ggplot2)
library(readxl)
library(janitor)

getData("ISO3")

# Get data for South Africa
southafrica <- getData("alt", country="South Africa", mask = T)

# For some reason, the South Africa map doesn't save as a RasterLayer object, so run the equivalent of this line, changing the filepath appropriately to access the _msk_alt.grd file generated
southafrica_1 = southafrica$`C:/Users/s1000334/Documents/PhD_Tetramesa/R Scripts/map_plotting/ZAF1_msk_alt.grd`

# Check that it's a RasterLayer object
class(southafrica_1)

##################################
# Using base-R
##################################

# Quick peek at the map
plot(southafrica_1, main = "SA elevation", col = grey(1:100/100))

# Import GPS points from an Excel file on GitHub
sample_gps = readxl::read_xlsx("G:/My Drive/Tetramesa Project/Source Modifiers/source_modifiers_updated_10_06_2021.xlsx", sheet = "Tetramesa_Clarke")

# Apply some filtering specific to this Excel sheet
sample_gps = filter(sample_gps, mitochondrial_COI == "TRUE" | nuclear_28S == "TRUE")

# Check data import
head(sample_gps)

# Clean the column names
sample_gps <- sample_gps %>%
  janitor::clean_names()

# Inspect the data
head(sample_gps)

# Generate the plot
plot( southafrica_1, main = "", col = grey(1:100/100), ylab = "Latitude", xlab = "Longitude" )
# If no colour is specified, the default palette used is rev(terrain.colors(255))
# E.g of a different coloured plot:
plot( southafrica_1, main = "", col = colorRampPalette(c("black", "orange"))( 255 ), ylab = "Latitude", xlab = "Longitude" )

# Add the GPS coordinates as red points
points(sample_gps$longitude, sample_gps$latitude, bg = "red", col = "black", pch = 21, cex = 2)

# Add a scalebar to the map
scalebar(d = 200, type = "bar", below = "km", xy=c(31,-34))